Solar Flair: A summary of the history and rise of solar in the global energy mix
What is Solar Energy?
The concept of using solar energy is no longer novel to most people. Before the recent explosive growth, we have seen it come through in various innocuous forms before such as calculators with the mini solar panel popularized by electronics companies Casio and Sharp in the 80s and 90s. Today however, it is seen as a much bigger energy solution and many future energy scenarios that aim for emissions reduction and weaning off from fossil fuels require solar to be a pivotal part of this mix. In this crammed read, the discussion mainly surrounds what has gotten solar to be this key and what challenges have still to be overcome to create a true transition in primary energy consumption (refer to Energy Transition Pt1 ).
THE HISTORY OF SOLAR ENERGY

While it might seem obvious today, the concept of producing electricity from the sun is the outcome of leaping and continuous momentum in science . Like many discoveries, inventions and technological developments; the science community builds on each other’s discovered and interlinked concepts as opposed to a “Big-Bang” or “Eureka” moment style of discovery we may tend to perceive due to hindsight bias as the historical context recedes further into history.
The modern starting point of solar is work by French Physicist, Alexandre-Edmond Becquerel in 1839 (at the age of 19) on the photovoltaic effect i.e. the concept that a material could generate electrical current and voltage by being exposed to light. A further key milestone in the journey is the 1905 paper by Albert Einstein at the age of 26 “On a Heuristic Viewpoint Concerning the Production and Transformation of Light” which expanded on the photoelectric effect (not the same as photovoltaic effect) and how light carries energy. This played a big part in bringing solar energy into broader acceptance and discussion. It is actually for this piece of work that Albert Einstein was awarded the 1921 Nobel Prize in Physics contrary to general expectation that it was for the work on the Theory of Special Relativity (Read: Why Einstein never received a Nobel Prize for Relativity). Further important developments then occurred in 1954 with the conception of the solar silicon cells by scientists at Bell Labs in New Jersey, USA, which forms a major foundation for the solar panel technology we see today.
As such, we see the sun’s energy transformed in two main forms today:
First is Concentrated Solar Power (CSP) which resembles conventional electricity methods. This involves taking solar energy and harnessing it with mirrors similar to taking a magnifying glass and using it focus the sun’s energy to create heat. This heat is then used to boil water and the steam generated to turn turbines and convert mechanical energy via magnets into electrical energy. This constitutes about 1% of total solar power installed capacity.

One of the worlds largest CSP energy plants, Noor Ouarzazate III in Morocco with an installed capacity of 150MW (or 0.15GW)

One of worlds largest Solar PV Plants, Bhadla Solar Park in India with capacity of 2245MW (or 2.25GW). For Africa related reference, that’s more than the capacity of Africa’s only nuclear power plant, Koeberg Power Station on South Africa’s Atlantic Coast which has a nameplate capacity of 1940MW (or 1.94GW)
Second is Solar Photo-Voltaic based solar i.e. electricity via solar panels which is linked to the photoelectric and photovoltaic principles highlighted earlier. This forms the overwhelming majority of solar energy capacity and usage. This is the only form of scaled electricity generation that doesn’t use the principle of turbine generated electricity.
SOLAR ENERGY GROWTH

When we fast forward to today, according to IRENA, solar currently constitutes approx. 600 Giga-Watts (GW) of the worlds installed electricity capacity out of a total installed capacity of about 6500 GW i.e. approx. 9% .
In 2019, renewables formed approx 72% of all new electricity capacity installed at 176 GW. Within the scope of this renewable capacity increase, solar was the majority having new installed capacity of almost 100GW or 55% of renewables capacity increase. This means solar was approx 43% of total new installed capacity both renewable and conventional.
It is however also important to note at this point that installed capacity does not necessarily equal usage given that usage is determined by availability and relative costs of an electricity source. It still however gives a decent indication to overall electricity trends. As at 2017, solar consumption was approx. 0.3% of primary energy consumption (refer to Energy Transition Pt 1 article) and 1.7 % of electricity generation.

Forecasts by the IEA to 2040 based on the Stated Policies Scenario of their 2019 World Energy Outlook i.e. existing policy frameworks and today's announced country policy intentions, portray solar becoming the largest segment of installed capacity as shown below.
Even though the IEA and other players have been guilty of underestimating solar’s growth in their forecasts, the important takeaway relates more to the trend than the exact growth rates since actual growth rates are subject to a myriad of complexity when considering such long time horizons.
REASONS FOR SOLAR GROWTH
Overall Availability
One of the key enablers of solar energy is the sheer availability of it on the earth. If you contrast this with most conventional sources of energy from fossil fuels to nuclear and hydro-electric , all are dependent on the geographical lottery in terms of localized availability. The world of globalized trade however, means a country or region doesn’t have to be solely dependent on what is locally available. However, there are cost implications to having to consume energy that is not locally available. Solar on the other hand is mostly available across the major populated sections of world (granted with varying intensity).
The intensity to which an area has solar resources is represented by its solar irradiance measured in Kilowatt hours per square meter (Kwh/m2). The measurement takes the form of Global Horizontal Irradiance (GHI). This is defined as the total solar radiation incident on a horizontal surface in Kwh/m2. GHI is in turn a combination of two irradiance factors i.e.

Direct Normal Irradiance (DNI) i.e. solar radiation that comes in a straight line from the direction of the sun at its current position in the sky and
Diffuse Horizontal Irradiance (DHI) i.e. solar radiation that does not arrive on a direct path from the sun, but has been scattered by molecules and particles in the atmosphere and comes equally from all directions.
When we consider this solar irradiance over a time period, it becomes solar insolation. This is similar to how electrical power generation capacity is measured in Megawatts (Mw) for instance while the actual electrical energy output is in Megawatt hours (Mwh).
The conversion from solar irradiance to solar insolation is represented in that 1Kwh/m2 of solar irradiance is equivalent to 1 peak sun hour of solar insolation. The level of irradiance and therefore insolation is affected by various elements of geography and seasonality such as location on earth relative to equator, climate, weather and time of day.

The map shows the global horizontal solar irradiance (GHI) according to Solar GIS with insolation figures per annum and per day shown on the scale. For benchmark reference, according to information on SolarReviews, a good amount of solar recourse in US for making use of solar energy at the home level is approx. 4Kwh/m2 using basic assumptions on the type of solar panel and it’s efficiency.
What forms an important distinction for solar pv in comparison to other conventional power generation methods other than not being turbine based is that it is currently the most decentralizable i.e. solar can be installed at the home level to produce power for a solitary home. You can’t for example in an economically viable way, install a coal power station solely for your property or neighborhood. Solar PV also links well to the important concept of distributed generation i.e. small/micro grid electricity generation for smaller, more specific localities.
As an indication of this, in the US for example, approx. 15.7m households were estimated to be powered by solar as at March 2020 which represents about 12% of the 128.7m US households. This sets the platform also for distinguishing solar utility power i.e. solar energy generated as a power source into the broader macro grid vs distributed power that can be generated by these households for self consumption with excess being fed into their local micro-grids.
The Virtuous Cycle: Technology > Costs > Policy, Repeat
The virtuous cycle is a term used to refer to the momentum building ecosystem that occurs when technological advancements push cost reduction which in turn forces government policy to legislate supportive regulations. Solar energy has benefited majorly from this positive feedback loop. These cycle elements don’t have to happen in this linear way but can happen in parallel as well. The ultimate point however is that as the adoption of solar increases driven by economic, social and technological factors, more money is availed to the solar ecosystem which together and in turn drives legislative changes in terms of emissions and electricity pricing arrangements. These effects and trends are amplified by having sizeable origins in China where the economies of scale effect has compounded development and production. The main sub-categories to emphasize here are the costs and efficiency trends in solar pv.
Solar Instillation Costs
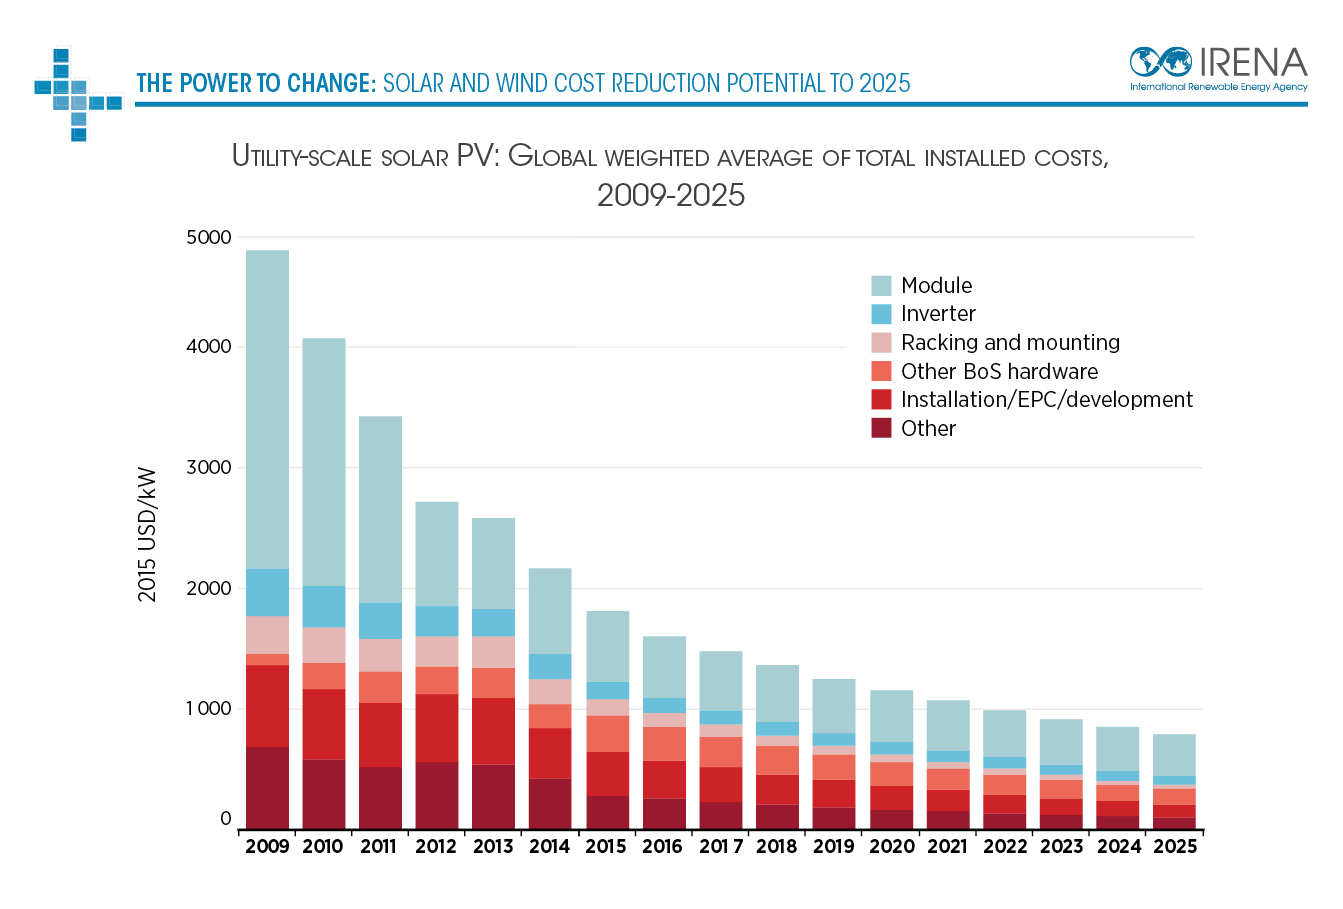
The cost reduction of this virtuous cycle can be seen in the chart as per IRENA’s 2016 Power to Change report showing the observed progression of solar installation costs by $/Kw . The trend observed is a reduction in all fronts of the solar pv installation. This is from the modules (panels) to the inverters required to transform the electrical energy generated in Direct-Current (DC) to the Alternative Current (AC) used by regular appliances. Finally, this also extends to the Balance of System (BoS) elements which include areas like the battery infrastructure.
Another financial related aspect that can be used to express the cost of solar pv is the Levelized Cost of Energy (LCOE). This is a measure of the average net present cost of electricity generation for a power generation source over its lifetime and is expressed in Dollars per Megawatt Hour ($/Mwh). One can think of it is a sort of net present value per megawatt hour of a power source. See below two outputs by Lazard with the first being the LCOE prgoression for solar for the decade 2009 to Nov 2019 as well as the 2009-2017 LCOE trends comparing different power generation sources.


Solar Panel Efficiency

Another key outcome of the technological trend has been the strides in solar PV efficiency. Efficiency is the percentage of the solar energy shining on a PV device that is converted into usable electricity. Currently this range is approx. 15-20% with some higher end outliers in the 20-25% range. This is a large improvement on the initial solar PV cells developed by Bell Labs which had an efficiency of 1%.
Higher efficiency PVs have been developed in lab settings but still not commercially viable for full roll out as shown in image below. The main driver of these efficiency gains comes from material science e.g. improvements in silicon which make up the panels and can be done as mono or poly-crystalline cells as well as how the panels minimize reflection of sunlight. It must be noted however that 15-20% efficiency is still a relatively low efficiency number compared to fossil fuel power generation which ranges from 37-60% efficiency.
CHALLENGES TO SOLAR GROWTH
While the picture solar paints over the last decade and for the foreseeable future proves very enticing on many fronts, there are still some challenges to overcome for wider scale adoption that go beyond the current technological limitations of the solar technology itself e.g. limitation of low efficiency. Other challenges exist and probably front and center of these challenges, is the one presented by the intermittency of solar energy and the current set up of electricity macrogrids. These are not independent but linked issues to each other.
Intermittency & Status-Quo of Grid Infrastructure
Intermittency refers to the issue that solar resources are not continuously available to convert to electricity as their availability is not subject to human control. This presents challenges because demand management is one of the most important aspects of electricity supply and in the absence of adequate storage, this intermittency problem then requires some form action to mitigate. Scaled solar energy generation which new and variable by nature already means challenges in co-existing with an old network and electricity infrastructure set up. Changes this takes financial resources and active policy.
This overall demand management problem presents itself in the so called “Duck Curve”. Some of the most readily available information on the Duck Curve comes from the California Independent System Operator (CAISO) that oversees electricity generation and transmission for California State, USA. This is a good informational base to work off of because of California’s aggressive goals for solar and also that if California were a standalone country, its GDP would be 4th globally sandwiched between Germany in 3rd and India in 5th.
The duck curve has its origins in the observation of the electrical load pattern i.e. the demand of electricity at different times of the day. This typical profile has a main peak in the evening when families cook supper and return from work, a secondary peak in the morning when people activate to get ready for the day and reduced shape during day time (see 2012 actual line in picture below) .

The duck curve then shows in the net electrical load pattern i.e. electrical demand pattern net of non-conventional energy input into the system as shown below. The image here shows the pattern of the net load as solar capacity inserted into the California grid increases annually.
The important take away being that peak sun hours in the afternoon tend to be at the time of lowest demand in the day while solar energy simultaneously comes on grid in its highest quantities. This effect subsequently increases as more solar is put into the grid system thereby forcing the grid’s net load pattern to resemble the profile of a duck. This is important because the demand supply imbalance points to economic challenges that should determine market prices i.e. excess supply over demand should drive market price down and vice-versa. It also complicates the managing of conventional power sources that require ever-steapening ramping up speed to meet peak electricity demand hours between 6pm and 8pm when sun is now down.
The mitigation for this intermittency problem has mainly taken the form physically of storage as technology in batteries improves e.g. Tesla’s Megapack Battery with approx 3Mwh of storage capacity or their world record South Australia 129Mwh battery capable of supplying 30,000 homes for eight hours. In addition, policy-based mitigation has seen solar energy utility power generation contracts being signed on a Feed-In-Tariff (FIT) basis i.e. power generator receiving a long-term cost based fixed price for solar generated electricity fed into grid regardless of market price or utilized solar electricity. This would also be in-spite of excess solar energy wasted through whats called curtailment. Approx 3/4 of solar arrangements globally, involve a FIT mechanism of some sort. This and similar types of arrangements have allowed solar projects to be enacted despite challenging scale profitability economics though we see this and other forms of subsidies and incentives reducing of late e.g. in China and the UK.
If solar energy is going to be blended into the energy mix with this duck curve situation, other conventional power generation methods like coal, gas have to have their generation capacity throttled and suddenly ramped up since their power provision may be excess in times of low demand when solar is already feeding into the grid. This complicated interaction between allowing renewables economic viability and conventional power economic viability is reflective of outcomes such as in Germany and Australia where balancing energy demand and supply has manifested in increased price volatility.

One of worlds largest floating solar farms, Sungrow Huainan Solar Farm in China with nameplate capacity of 40MW
Other challenges can be highlighted such as land usage but this in a way are not unique to solar as a utility power source as all utility power generation requires large space to develop. We also see this being addressed by ideas such as floating solar which is currently approx 3% of total solar infrastructure.
There are also more nuanced discussions relating to whether solar power is truly “renewable” and how clean it actually is especially if the processes associated with extracting silicon and other materials required for the output are in themselves intrinsically polluting. This will expanded on in separate articles and pieces going forward as it offers a wider window into the solar supply chain.
Closing remarks
To quote a probably overused solar industry pun: the future of solar is bright. Technology continues to support significant development. This means that unforeseen ways solar could become part of our energy mix continue to increase particularly at the localized and home level as elements like micro-grids become more popular. Another key characteristic is that because solar is anchored in material science, its future can play out based on transforming everyday surfaces into solar surfaces e.g. building roofs, building walls, building windows and vehicle roofs etc. These are ideas and concepts we will continue expanding on here on FutureWattage.
By Tare Kadzura ACMA, CGMA, EMME
Other useful video link(s)