Under the microScope: Examining the meaning of Net Zero Emissions
Can Net Zero Emissions truly be achieved?
Within the avalanche of discussion surrounding sustainability, one of the most prevalent cornerstones of this discourse is the concept of carbon emissions. Of particular scrutiny is the carbon emissions that result from human activity. This activity has underpinned the way society has functioned since the industrial revolution and the technological strides that came with it. These leaps are namely in the key economic and prosperity enablers of electricity , transport, heating, agriculture and industrial manufacturing.
As such, recent developments in prioritizing tackling carbon emissions caused by human activity (also known as anthropomorphic emissions) have meant an increasing array of commitments by governments and companies to move towards net zero carbon emissions within various time-frames (most around the 2050 mark) in order to mitigate climate change. Some of these committing entities are highlighted in the previous Futurewattage article summarizing the December 2020 Financial Times Energy Transitions Summit. It is therefore important to understand what net zero emissions means, the framework it is measured and reported as well as the main challenges adjacent to the idea of net zero.
Why the focus on anthropomorphic emissions?
The interactions of life on Earth in terms of inhabiting species, human activity and astronomical or geographical phenomena is undoubtedly a complex feedback loop. Given this complexity, one of the key things to distinguish becomes what impacts are driven by natural phenomena versus that which are man-made.
Phenomena such as Earth’s axial procession (wobbling motion), axial tilt and eccentricity (orbital shape around the sun) are constantly changing all be it at a severely lethargic pace only visible over large spans of millennia. These variables are captured in what is called Milankovic Cycles named after the Serbian geophysicist and astronomer Milutin Milanković who together with a German meteorologist and geophysicist came up with the model in 1924. The cycles are largely considered a scientifically viable explanation for some long term climate change observations e.g. those pertaining to the start and end points of historical ice ages.
With that said, scientific research and current consensus points to a significant change in the Earth’s CO2 levels since the industrial revolution as shown in chart below available on the US National Aeronautics and Space Administration’s (NASA) climate change page.
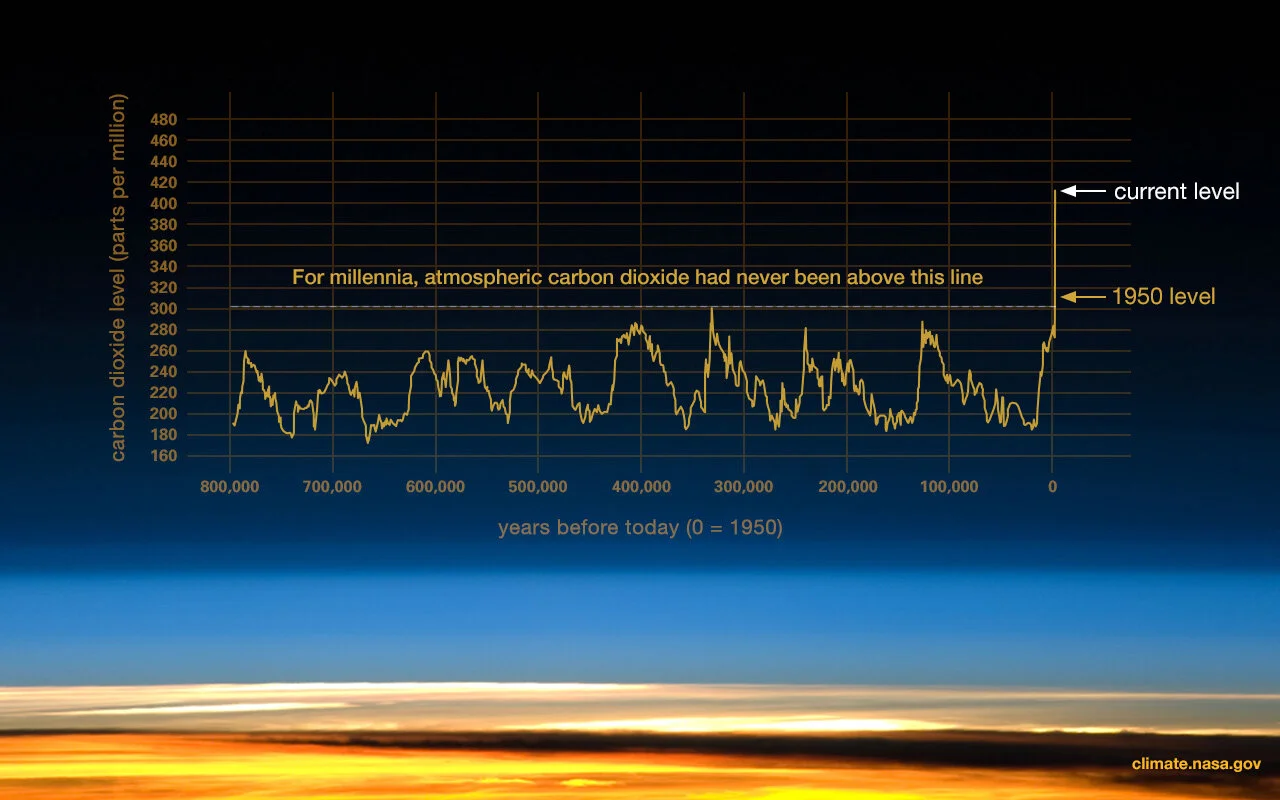
This drastic and relatively rapid change has been responsible for changes to important systems that impact the way species live on earth in terms of climate and it’s subsequent expressions e.g. temperature and water levels. This high pace of change forms part of the reasons that Milankovic Cycles are considered not explain the current CO2 and trajectory as summarized in the Nasa aritcle “Why Milankovitch (Orbital) Cycles Can't Explain Earth's Current Warming”. We also notice that by-in-large, the Earth’s multi-million year carbon cycle does not release CO2 via combustion at scale into the atmosphere naturally other than via volcanic eruptions and these only make up about 1 -2% of what human activity emits. Climate science and the models used to model climate is are a notoriously challenging discipline and conclusions stemming thereof are still evolving. It is therefore important to always consider this as we nagivate information relating to climate science’s ability to separate natural cycle vs human caused climate occurrences.
A point to also bear in mind is that even with a radical impact by mankind on the planet, the extremely long and almost incomprehensible scale of Earth’s age in comparison to the average humans’ infinitely minute and fleeting slice of this timeline, it is sometimes easy to conflate the relationship that the Earth needs humans when it is largely the other way round . As such, a new future equilibrium for life of differently evolved and adapted species to match new climate conditions is a possibility even though these species including humans might not be the ones we see today. There has been evidence of some life adjusting to climate change observed in some species of squirrel, bird, mosquito, flies, corals and plants e.g. changing mating timelines or shifting habitats as well as at the genetic level, evolving to match the warmer conditions. However, such change is challenging for most species especially those larger in size with long generational timelines that subsequently tend to evolve very slowly. This is an important set back given that anthropomorphic emissions driven climate change is occurring at a pace evolution of such species cannot match.
What does Net Zero Emissions mean?

In the global drive we see to reduce emissions of CO2, a common reference has been net zero also referenced at times as carbon neutrality. At the most basic level, a net zero carbon emissions target means a commitment by an entity e.g. municipality, company or country to having the carbon emissions in its value/activity chain fully offset by taking out the equivalent emissions from the atmosphere. This is not saying the same thing as the even harder zero carbon emissions which instead refers to finding a full solution for energy that does not involve hydrocarbons completely i.e. 100% energy from a combination of solar, wind, hydro-electricity or nuclear including non-hydrocarbon electrification of all forms transportation. The World Resource Institute (WRI) identifies 10 main strategies towards anthropomorphic emissions reduction shown below. Each area also represents different extents of impact and agility to which they can be transformed but as highlighted in previous articles, all contributions will be important given the scale of change required and the lack of a “silver bullet” solution.
Other potential contributors in the mix are so-called negative emissions scheme technological solutions such as carbon capture and storage (CCS) which have also been making great strides in becoming more economically viable and scaled as more projects come online. To this effect according to the Global CCS Institute , “global pipeline of CCS facilities has grown for three years in a row, with capture and storage capacity nearly doubling within three years and increasing 33% since 2019. A total of 65 commercial CCS facilities are in various stages of development globally. Twenty-six CCS facilities are in operation and are capturing 40 million tonnes of carbon dioxide annually”. This figure however still only represents approx 0.1% of annual emissions which are at approx 35 billion tonnes annually.
Framework for measuring Net Zero

Measuring net zero and achievement thereof is currently mostly considered based on “scopes” of emissions from scope 1 to scope 3. These levels of scope start at the most direct entity level and expand outwards i.e.
Scope 1: Emissions resulting from activities under the direct control of an entity’s value chain such as operational fleets, flaring at oil and gas fields and other emissions via infrastructure leakages .
Scope 2: Emissions arising from energy purchased by an entity for its operations such as power and heating.
Scope 3: Emissions arising from associated activities not directly controlled by the entity such as emissions from use or consumption of the entity’s products or services, supply chain operations, leased assets, procurement of equipment, employee commuting or business travel, water use, and waste management etc.
The GHG Protocol diagram reflects the categories of each scope to which reporting is done against.
Challenges
High Scope 3 proportion of emissions on average

The proportional spread of emissions in the three scopes will differ from industry to industry for instance oil and gas majors would have scope 3 making up approx. 90-95% of total emissions. This matches the range most large businesses find themselves in terms of the proportion of scope 3 emissions which estimates put at 80-97% - particularly those that involve manufacturing within their process in some form - outsourced or otherwise. Note these proportions would however not equate to the same absolute emissions quantity across industries. This inclination towards scope 3 making up the majority is also mirrored in examples of the carbon emissions intensity of broad based investment portfolios such as MSCI’s flagship global equities index the ACWI (All Country World Index).
Below is the industry spread of scope 3 emissions by industry into their categories from the same MSCI report

Standardization of reporting
It is also worth noting that scope 3 emissions in one industry could be scope 1 or 2 to another which implies that measurement and disclosure of emissions requires a robust interconnected framework for emissions accounting. This is challenging but continually evolving and improving as the emissions and ESG agenda has gathered momentum. The idea being that with time, this reporting is fully unified and captures all necessary flows in the same way for example a tax regime like Value Added Tax (VAT) mostly captures amounts across the value chain.
To this effect, the sustainability accounting guidelines provided by the GHG Protocol in their Corporate Accounting and Reporting Standard which are in turn used as an accounting basis by the Sustainability Accounting Standards Board (SASB) for disclosure of emissions in the three scopes have been important developments. According to these guidelines when submitting on emissions, it is mandatory to report scope 1 and 2 emissions given the shorter degrees of separation from such emissions. This closer distance from emissions in terms of control is taken as a proxy for the actionability to have levers available to the entity to change them.
Voluntary reporting of scope 3
However, scope 3 disclosure remains voluntary though increasingly we see them considered important for stakeholder transparency and even competitive advantage. This still however poses a challenge since as established most large company emissions fall in the realm of scope 3. In addition, even when scope 3 is reported, a 2013 US Supply Chain study revealed that on average only about 22% of scope 3 emissions where captured by companies in their reporting. Also the argument around how scope 3 emissions being considered outside the proximity of control to deem them voluntary to report could be challenged especially in the upstream where vertical supply chain integration effectively reduces that distance.
Significant strides have however been made to counter such inconsistency as institutions like the GHG Protocol and associated standards evolve particularly post the 2015 Paris Agreement. The journey to full accuracy and comparability however continues given the voluntary nature of scope 3 reporting. According to finance investment services company MCSI, as of March 2020, only 18% of constituents of the MSCI ACWI reported Scope 3 emissions and the proportions where even lower when individually looking at the 15 categories that make up scope 3 as shown below.

As time progresses, we might see a space develop where certain categories of scope 3 are made mandatory for certain industries or company sizes in order to mitigate the low volunteer rates. For example in the UK, listed and large private companies are mandated to disclose on the scope 3 categories relating to energy use and related emissions from business travel in rental cars or employee-owned vehicles where they are responsible for purchasing the fuel. We could therefore see more and wider coverage regulatory variations of this nature across global governments.
Double counting emission reductions
Another area that has received attention in addressing disclosures and their measurement challenges is the area of double counting emissions reductions as this would undermine emissions targets amongst other things. Research and recommendations have posed solutions for this such as those detailed in a paper by the Stockholm Environment Institute titled Addressing the risk of double counting emission reductions under the UNFCCC. Recommendations revolve mainly around consistent and standardized accounting of emissions units as well as centralized record keeping which is something we have discussed here to a degree already. A potential solution we can further infer is the use of blockchain technology whose application to such record keeping problems has been discussed on the prior Futurewattage article regarding use of blockchain in energy.
Final thoughts
With this foundational background, we can see that net zero targets are quite challenging if they are to be achieved across all scopes. Concerted effort, standardization of measurement and stakeholder engagement are required to ensure progress is made across all industries within the desired time-frame target of about 30 years. We see examples of this increasing pressure particularly on hydrocarbons based industries such as the March 2021 US Securities Exchange Council (SEC) denying requests from both ConocoPhillips and Occidental Petroleum to throw out shareholder motions that would force them to lay out detailed plans for cutting their Scope 3 emissions.
It will also be interesting to see how the behavioral and economic changes brought about by the covid impact on business models shape up and translate onto the statistics of scope categories of e.g reduced business travel or increased e-commerce home deliveries .
As an interested observer or active participant, it is and will be important to scrutinize net zero claims and announcements with regards to scopes and definitions being used in defining net zero targets. There are ways language, semantics as well as absolute vs proportional perspectives can elicit different interpretations to net zero targets especially in the voluntary scope 3 arena. At the same time however, the fact that developments have brought scope reporting this far to the extend that it is a fleshable topic backed with corporate and government proclamations indicates the mammoth degree of terrain already progressed. Only time will tell if this progress, and that progress which is undoubtedly following, is enough.
Other useful videos